Charts in Livewire 3 & Volt
In this article, we are going to see how we can easily create charts in Livewire 3 and Volt. For that, we will use the Livewire Charts package.
First, we need to create a fresh Laravel application, and install the laravel/folio, livewire/livewire, asantibanez/livewire-charts, livewire/volt packages:
laravel new stats-app
cd stats-app

composer require laravel/folio:^1.0@beta livewire/livewire:^3.0@beta livewire/volt:^1.0@beta asantibanez/livewire-charts
Next, let’s run the “install” commands for the packages we’ve just required:
php artisan folio:install
php artisan volt:install
php artisan livewire-charts:install
After, let’s create a new Folio page to display our charts:
php artisan make:folio stats
This command will create an resources/views/pages/stats.blade.php file. And, as reminder, Folio’s blade views automatically create a route that matches the view’s path. So, in this case, we will have a /stats route.
Let’s open this file and replace its content with the following:
<html>
    <head>
        <title>Stats</title>
    </head>
    <body>
        <livewire:expenses />

        @livewireChartsScripts
    </body>
</html>
Note that, we have added the @livewireChartsScripts Blade directive as required by the asantibanez/livewire-charts package. And we are also including the livewire:expenses component. Let’s create this component now:
php artisan make:volt expenses
This command will create an resources/views/livewire/expenses.blade.php file. So, let’s open this file and replace its content with the following:
<?php

use function Livewire\Volt\{computed, state};
use Asantibanez\LivewireCharts\Models\PieChartModel;

state(food: 0, shopping: 0, travel: 0);

$incrementFood = fn () => $this->food++;
$incrementShopping = fn () => $this->shopping++;
$incrementTravel = fn () => $this->travel++;

$expenses = computed(fn () => (new PieChartModel())
    ->setTitle('Expenses by Type')
    ->addSlice('Food', $this->food, '#f6ad55')
    ->addSlice('Shopping', $this->shopping, '#fc8181')
    ->addSlice('Travel', $this->travel, '#90cdf4'));

?>

<div>
    <button wire:click="incrementFood">+ Food</button>
    <button wire:click="incrementShopping">+ Shopping</button>
    <button wire:click="incrementTravel">+ Travel</button>

    <livewire:livewire-pie-chart
        key="{{ $this->expenses->reactiveKey() }}"
        :pie-chart-model="$this->expenses"
    />

</div>
Finally, if you php artisan serve our application, and we visit the /stats page, you will see the following:
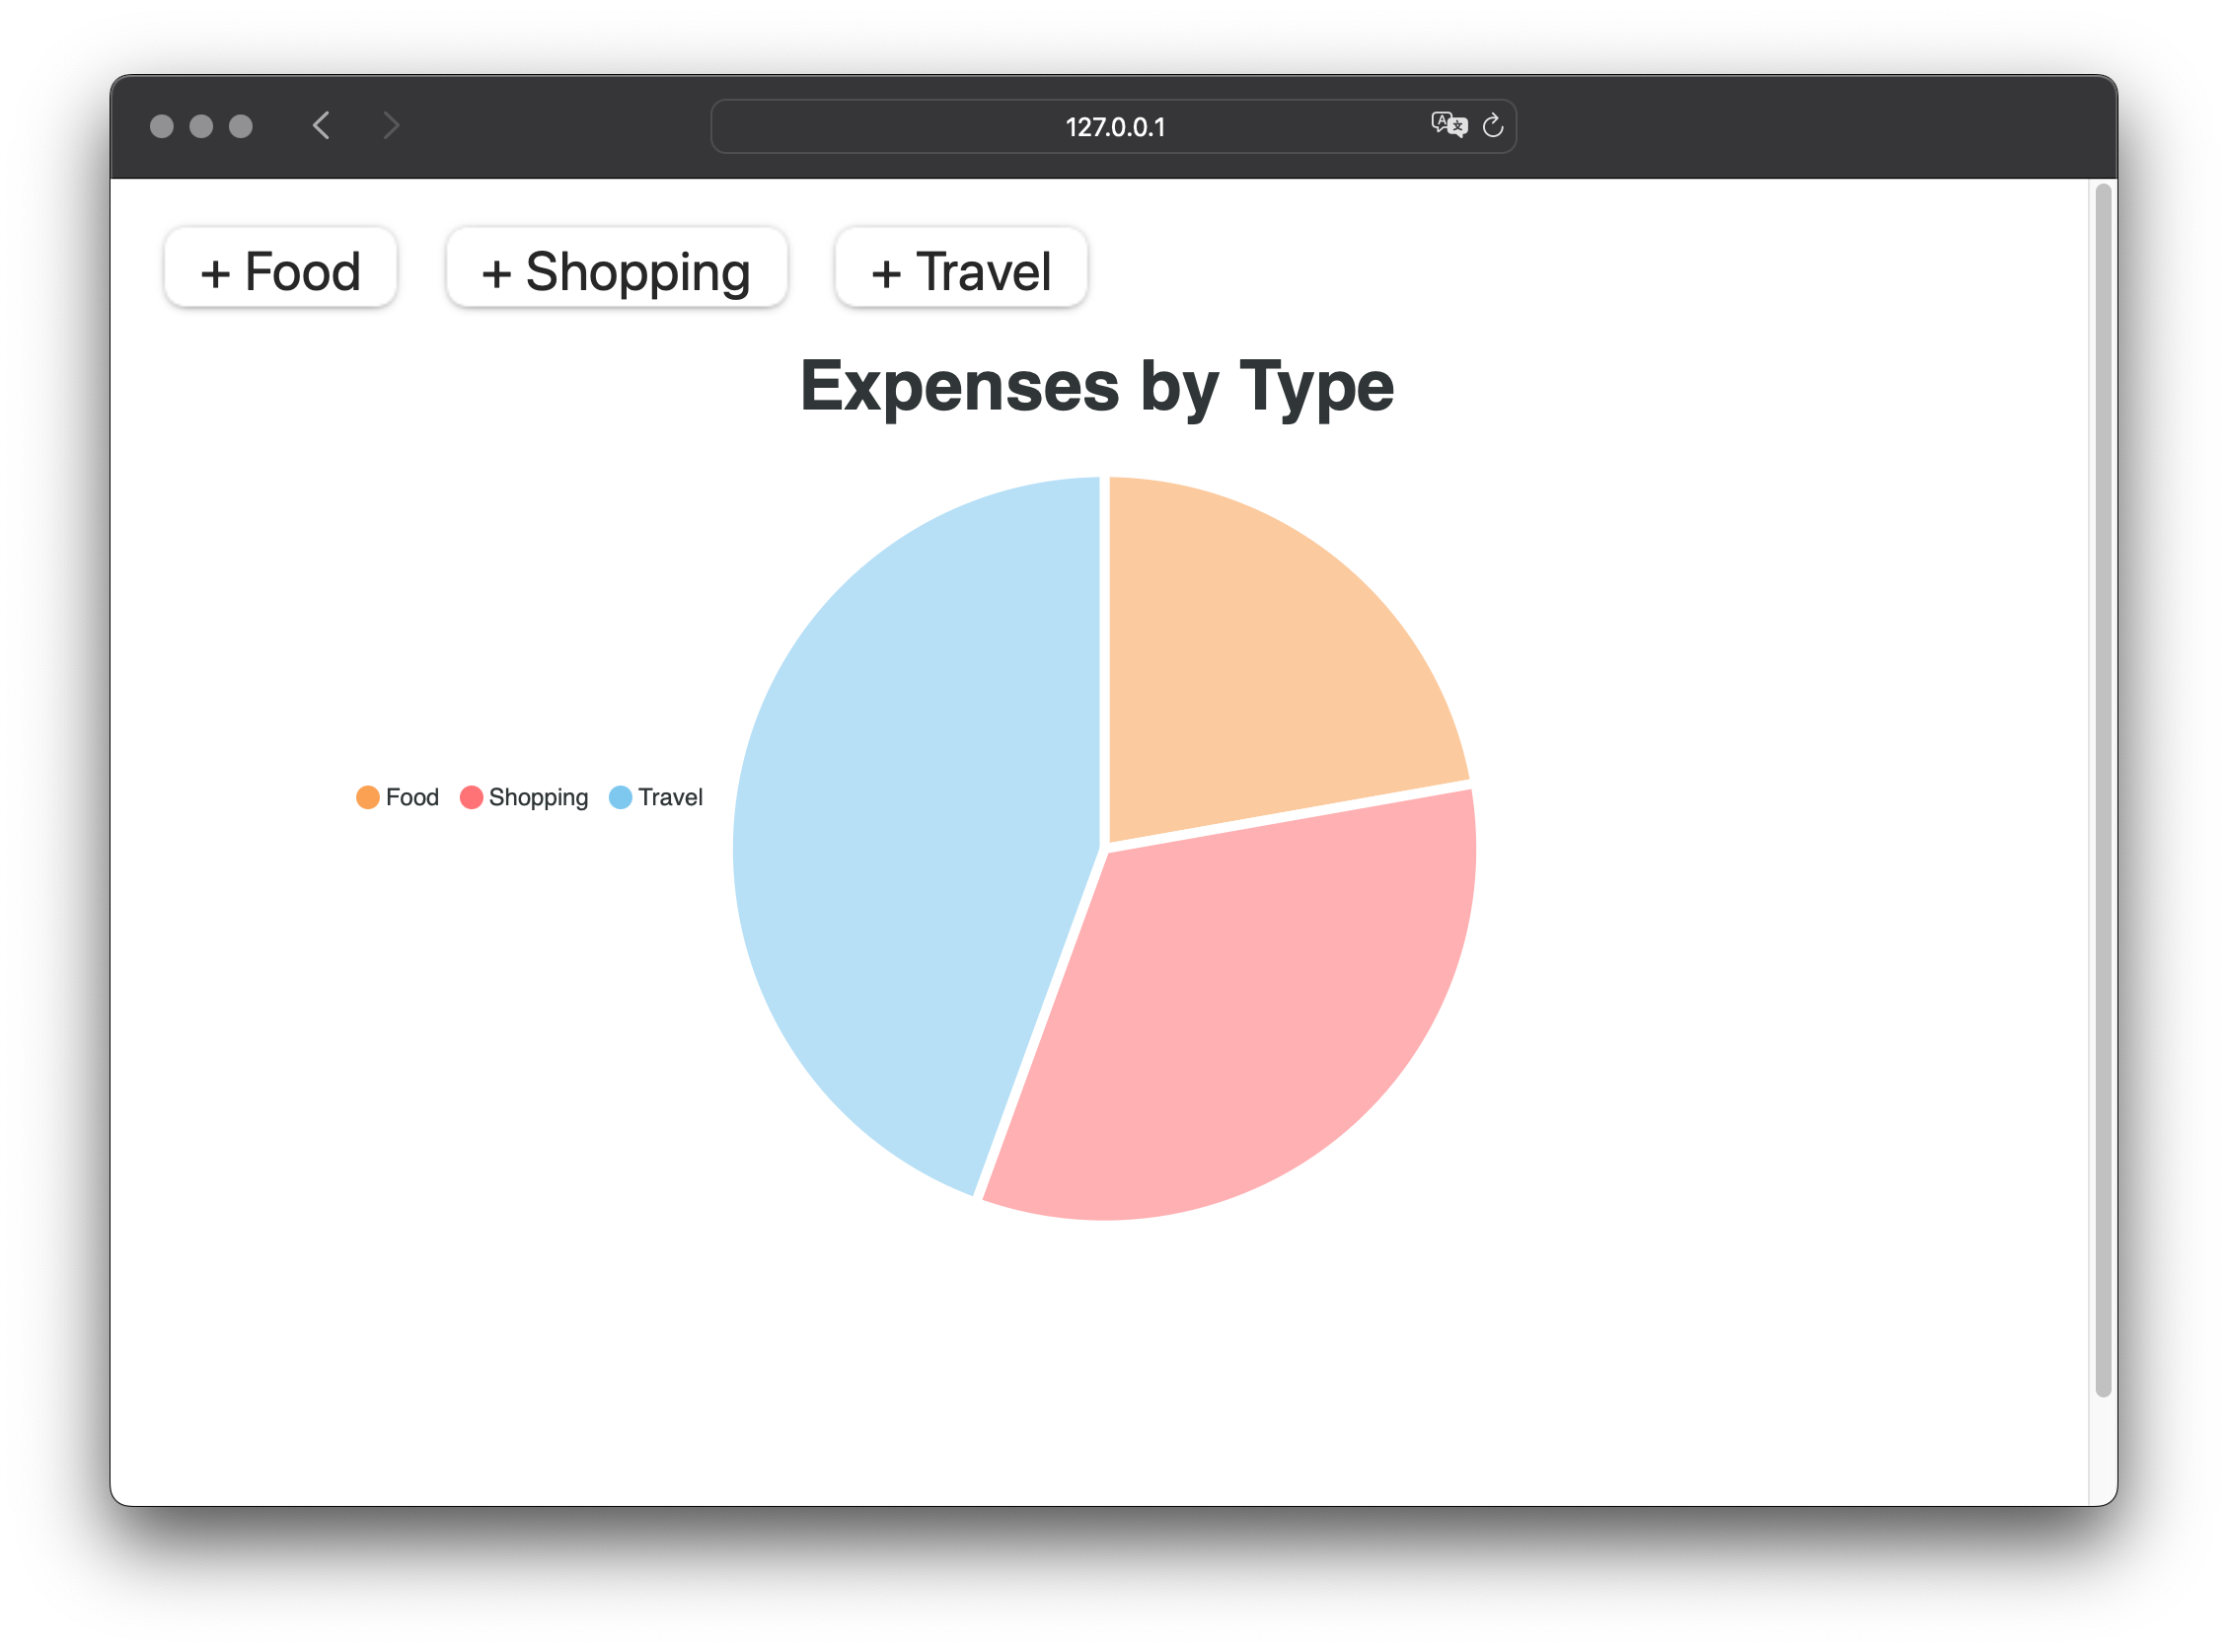
Every time you click on a button, the food, shopping, or travel state will be incremented. And the chart will be updated accordingly because our chart model is a “computed” property.
And that’s it! We have built a simple Chart application using Laravel Folio, Livewire, Livewire Charts, and Volt. If you want to learn more about these four packages, check out their documentation:
Hope you have enjoyed this article. See you next time!
I hope you have enjoyed this article. If yes, please consider supporting my work — my mission is to spend more time maintaining the dozens of projects that I've written/collaborated on over the years and continue developing new projects to make PHP development more productive and enjoyable.